Now that we have ample Medicare final claims processed for the first quarter of Calendar Year (CY) 2015, I was curious to see how the Medicare case-mix weights and revenue were impacted, relative to the Home Health Final Rule published on November 6, 2014.
Overall, CMS was expecting the revenue impact to be a negative .3% across all agencies. Based on SHP’s national database, I compared the CY 2014 overall Medicare revenue per episode against the Q1 2015 data. Interestingly, the overall revenue increased 1.24% rather than decreased. The final rule also noted that LUPA rates would increase by 5.6% and based on our data, the rates have increased 5.0%.
A plethora of changes went into the final rule, including case-mix weight adjustments for each of the 153 HHRGs, completely new Clinical and Functional scoring thresholds, and the blending of the new Core-Based Statistical Area (CBSA) designations, among others. I heard from many agency CFO’s the difficulty they had in budgeting for these changes. Hopefully, by now you have had a chance to see how close to budget you are performing.
The Medicare case-mix weight changes are a little harder to analyze. There was no corresponding CMS schedule highlighting these changes as there was for the revenue changes. In the final rule, the 2015 National Standardized 60-day Rate did include a case-mix budget neutrality factor of 1.0366. The overall base rate increased 3.2% when including this factor. Given CMS’s negative revenue projection, this implies they expected the case-mix weights would be lower than the CY 2014 run rate. In fact, using the SHP database, the Non-LUPA case weights did decrease by 1.62%, a little less than I was expecting. I wondered if the changes were consistent across the country, so I compared the non-LUPA case-mix weight changes by Census Region. The table below shows the results.
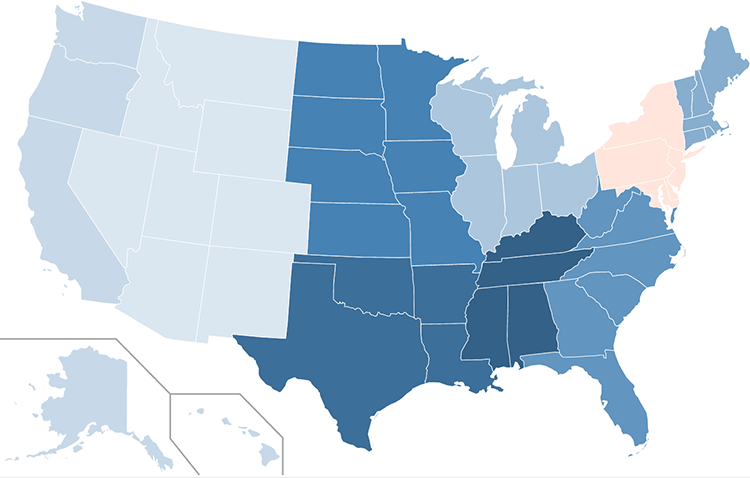
| Census Region | CY 2014 | Q1 2015 | % Change | |
|---|---|---|---|---|
| Middle Atlantic | 1.012 | 1.023 | 1.02% | |
| Mountain | 1.102 | 1.101 | -0.07% | |
| Pacific | 1.013 | 1.008 | -0.52% | |
| East North Central | 1.053 | 1.039 | -1.30% | |
| New England | 1.038 | 1.024 | -1.32% | |
| South Atlantic | 1.120 | 1.096 | -2.08% | |
| West North Central | 1.052 | 1.023 | -2.79% | |
| West South Central | 1.047 | 1.015 | -3.06% | |
| East South Central | 1.059 | 1.021 | -3.56% |
It is noteworthy that the one region, Middle Atlantic actually saw an increase in case-mix weight. This region also had the lowest case-mix weights in CY 2014 to begin with. How were your agency results in the first quarter? SHP clients can use the Financial Executive Advantage – LUPA Metrics report to see both the Non-LUPA and LUPA revenues/episode and case-mix weights in comparing to SHP’s state and national benchmarks.
Tags