

Five Stars Is Still in Reach - and There’s a Practical Way to Get There
Five-Star Quality Rating · Quality Measure Improvement
The July 2026 refresh raised the bar for a 5-star Quality Measure rating. But when you score facilities against the new thresholds, a large group sits just below the line — close enough to recoup a star the recut took, or claim one that's suddenly within range.
A practical guide for SNF/LTC teams · Based on CMS quality-measure data and the July 2026 Five-Star Technical Users' Guide, scored against the current thresholds.
The recut of the QM thresholds got a lot of attention for what it took away — the share of facilities holding a 5-star QM rating dropped by several points. That's worth understanding, but it's the past. The question that actually helps a facility is forward-looking: against the new bar, how close am I, and what's the most productive way to close the gap? When you measure every facility's distance to the next star under the current thresholds, the answer for a surprising number of them is: not far at all.
|
885 four-star facilities within 50 points of a 5-star QM rating |
375 of them within 20 points — roughly one strong quarter |
~4 in 10 four-star facilities within 100 points of five stars |
These aren't abstractions. A 50-point overall gap is the kind of distance a facility can cover in a cycle or two of focused, legitimate improvement — and hundreds of facilities are inside that range right now. Some are recovering a star the rebasing pushed just out of grasp; others are within reach of a rating they've never held. Either way, the opportunity is real. What separates the facilities that capture it from the ones that spend two quarters explaining a number is where and how they direct the effort.
How close four-star facilities sit to a 5-star QM rating
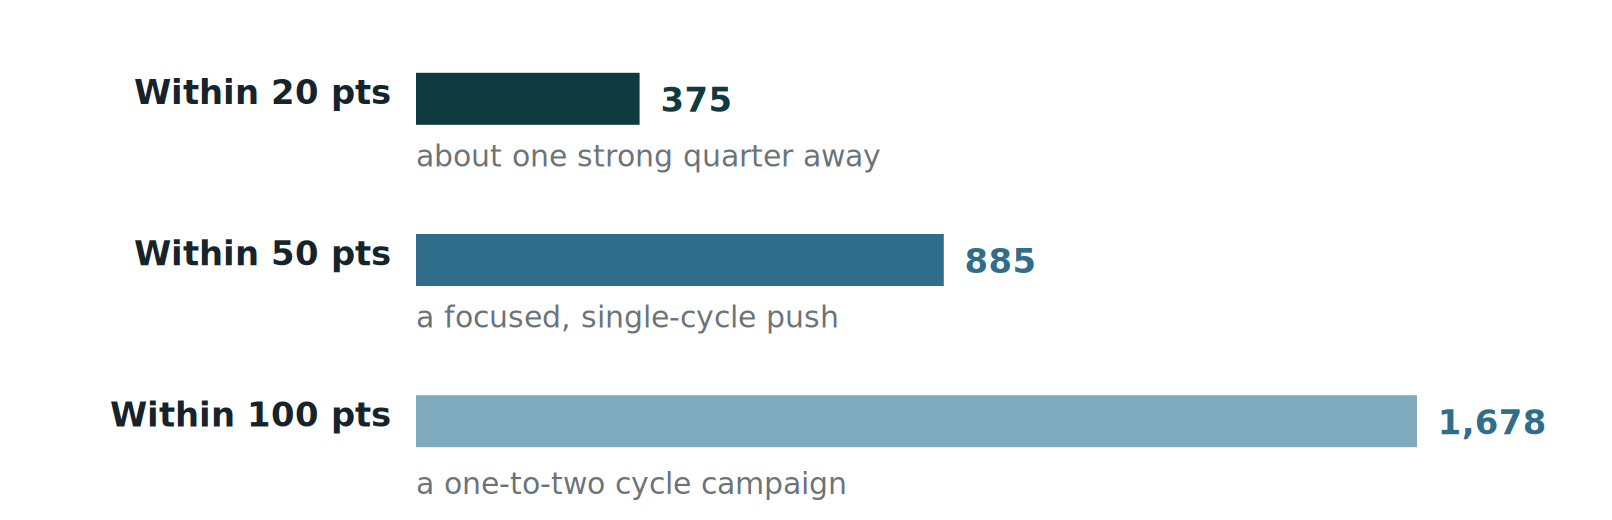
Roughly four in ten four-star facilities sit within 100 points of five stars, and about one in eleven is within a single strong quarter. Source: CMS quality-measure files, July 2026, scored against current thresholds.
|
The bar moved. It didn't put five stars out of reach — it clarified who's close and made the path worth walking. |
The Other Direction
The same measurement shows who's at risk of a drop
Distance to the next star and distance to the last one are the same calculation, read in opposite directions. Run it toward the floor of a facility's current tier and a second group comes into view — facilities close enough to the edge that a modest slip costs them a star. This group is larger than the one within reach of a gain.
|
1,285 facilities within 20 points of dropping a star |
2,708 within 50 points — one soft quarter |
5,219 within 100 points of a decline |
The exposure sits highest exactly where it costs the most. Of the roughly 4,200 facilities holding a 5-star QM rating, 837 are within 50 points of losing it, and 442 within 20 — one weak quarter from forfeiting the rating that anchors their referral relationships and managed-care conversations.
And here is the part a facility can't see from its current star: some of that exposure has nothing to do with a decline in care. The claims-based measures re-baseline on CMS's schedule as older data ages out and the national distribution shifts — so a facility can lose ground because its year-old claims data rolled forward, not because anything changed on the floor. The same 12-to-18-month lag that slows improvement also makes this kind of erosion invisible until it lands. The only way to catch it early is to project it forward, before the refresh makes it real.
You don't need a sophisticated tool to find your own position — whether you're reaching for a star or defending one. Three practical approaches will take most facilities most of the way, and they serve offense and defense equally: accurate coding protects a rating as surely as it earns one. They hold up whether you run them on our platform or your own spreadsheet.
Approach 1
Start with accurate MDS coding — it's the foundation, not a lever
Before you try to improve any measure, make sure the number you're chasing is real. Nothing distorts a quality measure faster than inaccurate MDS coding: it manufactures a numerator and a rate that don't reflect the care you actually delivered — in either direction. Miscode events in, and you're working to fix a problem your own data invented. Miss events that belong, and you're blind to a real one.
The discipline is straightforward to state and demanding to live: code to the RAI Manual and the current QM specifications, every time. Many measures have precise definitions worth knowing cold. A urinary tract infection has to meet a specific set of clinical criteria within the look-back window to count. Catheter status is defined by particular assessment items and recognizes clinically indicated use. Knowing these specifications isn't about finding things to leave off — it's about ensuring your data tells the truth. When your coding is accurate, your rate is trustworthy and improvement work starts from solid ground. When it isn't, everything downstream is guesswork. The authority here is the RAI Manual (Chapter 3) and the CMS QM technical specifications; if your MDS team can't point to the specification behind a coded item, that's the first place to look.
Approach 2
Target the measures where a little movement goes a long way
Not every measure rewards effort equally. The ones that do tend to share a trait: a small denominator, so that preventing a handful of events shifts the rate enough to cross a scoring threshold. Find yours and start there — but lead with the clinical case, not the point math, because that's what makes the gain durable and defensible.
Two common examples show the pattern. A facility's in-house pressure injuries respond to a disciplined skin-and-wound program; each avoided injury is a resident spared harm, and because the measure's denominator is modest, a few prevented cases move the rate. The discharge function score responds to targeted therapy intensity and discharge planning — and, critically, it acts on residents who are in your building right now, while there's still time to change the outcome rather than record it after the fact. Look across your own measures for that combination — small denominator, clinically actionable, resident benefit and rating benefit pointing the same direction — and you'll usually find your best near-term opportunities.
Approach 3
Know which measures can move soon — and which can't
Your QM rating blends measures that run on very different clocks, and misjudging the timing wastes effort. The MDS-based measures refresh quarterly; a legitimate clinical or coding improvement shows up within a quarter or two. The claims-based measures — hospitalizations, ED visits, rehospitalization, and successful community discharge — are built on data that lags roughly 12 to 18 months and rolls forward slowly. A strong quarter of work today may not surface in those numbers until well into next year.
When your improvement work shows up in the rating
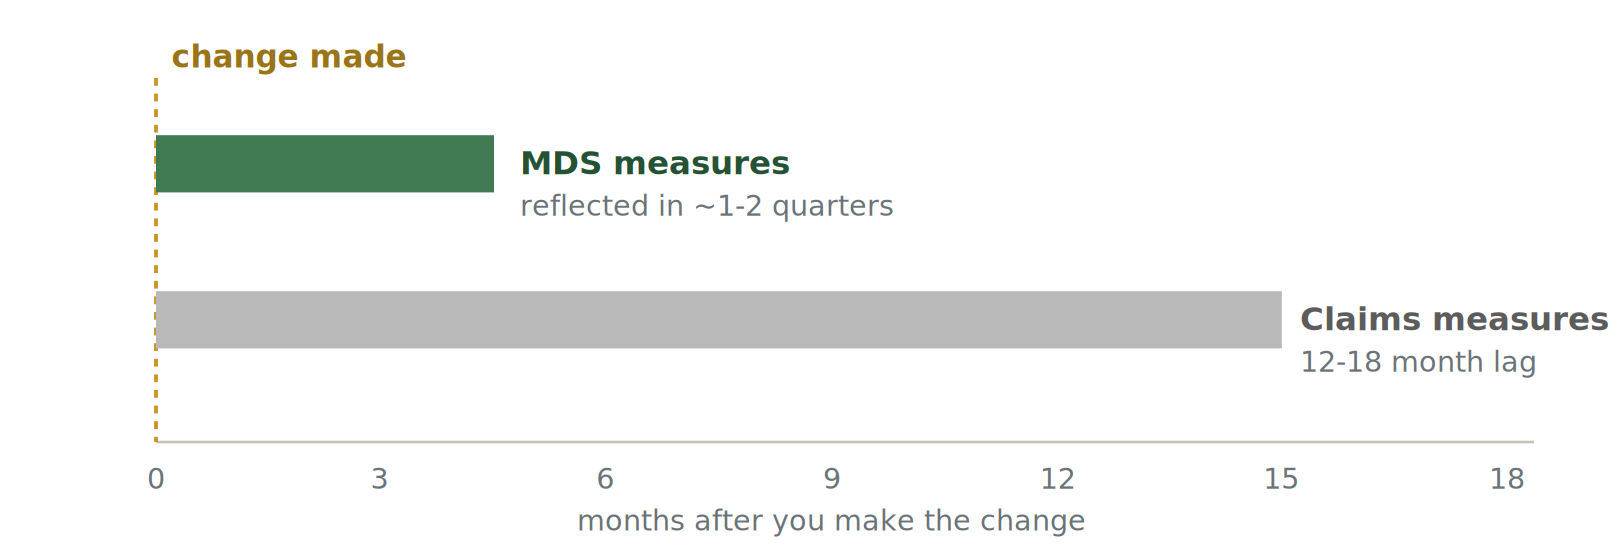
Near-term effort aimed at a fast rating change belongs on the MDS-based measures; the claims measures are a longer campaign to monitor, not chase for a quick star. Source: CMS measure specifications and public-reporting timeframes.
This doesn't make the claims measures unimportant — they count toward your score and matter over time. It means sequencing: put near-term effort where it will actually register this year, and treat the claims measures as a slower, tracked campaign rather than a lever you can pull for a quick result. Building a star strategy on a measure that won't reflect your work for a year and a half is building on a delayed signal.
How SHP Helps
The approach is yours — we make it faster
A facility willing to audit its coding, target its low-numerator clinical measures, and respect the claims lag can find and pursue its own opportunity with nothing more than discipline and a spreadsheet. What SHP adds is speed and clarity, so the decision doesn't wait on the arithmetic. Instead of hand-calculating where you sit against shifting thresholds, our analytics show your position and the exact distance to the next star. Our measure forecasting projects where your rating is heading before the refresh confirms it, and our active-resident discharge function reporting displays estimated scoring while they're still in your care — turning a measure you'd normally learn about after discharge into one you can act on today. The three approaches are yours to run either way; SHP simply removes the complex calculations between you and the next decision.
|
See where your facility stands against the new thresholds. SHP's Five-Star analytics show your exact distance to the next star — and flag the measures worth moving first. |
The Bottom Line
A harder bar, a clearer map
The rebasing thinned the top tier, but it didn't close the door. For hundreds of facilities, a 5-star QM rating is a disciplined quarter or two away — a star to recoup or one newly within range; for hundreds more, it's a rating worth protecting before it slips. The facilities that come out ahead will be the ones that start from accurate data, spend their effort where it moves the rate soonest, and plan around the measures that can't move quickly — whether they're climbing or holding their ground. Whether you do that with our tools or your own, the path is the same, and it starts now.
|
About the analysis. Facilities' quality measures were scored against the July 2026 Five-Star thresholds and the current Technical Users' Guide specifications to estimate each facility's distance to the next star. Figures describe facilities with a published overall QM rating in the July 2026 refresh; distance estimates are directional and depend on each facility's specific measure mix. One principle throughout. Every improvement described here rests on accurate documentation of true clinical status. Coding to the specification is the requirement. |
About the Author

Greg Seiple
Vice President - Clinical Informatics
Greg Seiple's journey in Long Term Care began as a nursing assistant in 1993, while pursuing his nursing degree. Over 19 years with HCR ManorCare, he progressed from various facility roles to Assistant Vice President in Clinical Services. Greg's expertise extends to VP and SVP roles in corporate clinical teams. Now, as VP of Clinical Informatics at SHP/IntelliLogix, he brings a wealth of experience. Additionally, Greg shares his knowledge as an adjunct instructor at Penn State University, teaching in the Nursing Home Administrators course.