Are Home Health Agencies Adjusting Visits to Make Ends Meet?
Medicare cuts have decreased reimbursements by 3.37 percentage points since CY11, yet home health agencies face new regulations and increased costs associated with the Affordable Care Act, with its aim of reducing costs, improving quality, and making sure patients are satisfied with their care.
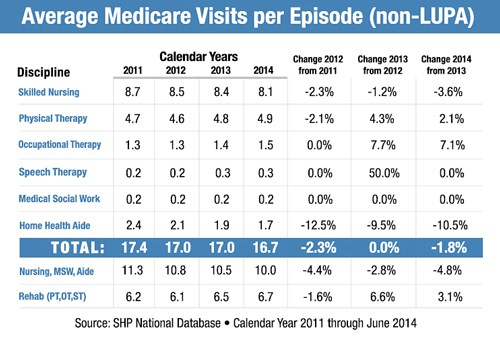
One way agencies are managing their costs is through tighter management of their visits per episode. Based on SHP's national database, as expected, visits per episode have been decreasing by close to a full visit over recent years, but there is something else in play.
While total visits per episode have declined, therapy visits have actually increased by .5 visits over the same time period. Clearly, that means that skilled nursing, social work and aides visits would need to reflect a greater net decrease during the same period, which is exactly what has happened. From our data, we see that agencies are using higher therapy visits and a decreasing percentage of LUPA episodes to overall episodes to help mitigate the impact of the decreasing reimbursements. Below is the episodic visit data from the SHP National Database over the last four years.
We see three important implications of this trend:
First, as this trend continues, measurement against national and state benchmarks will be increasingly important, especially in light of increasing costs and decreasing reimbursement rates.
Second, using detailed data to understand where there may be over or under utilization of visits per episode will be a key factor. Drilling down to Diagnosis groups and HHRGs is a good start to understanding where your agency may have opportunities.
Third, remember that the patient satisfaction/quality side of the equation must be kept in balance. Compare how your patient satisfaction scores and outcomes are impacted by your visit utilization. For example, do your agency outcomes change in comparison with fewer visits per episode? What is the connection between patient satisfaction and visits? Comparisons in this way will be critical as CMS moves toward Value Based Purchasing (VBP) as outlined in the FY15 HHA Proposed Rule.
As costs increase, reimbursement rates decrease, and pressure to ensure satisfied patients intensifies, agency leadership will be looking closely at the data that will help them manage all three legs of the ACA’s triple aim.