Hospice data analytics & benchmarking
SHP for Hospice gives your organization the power to effectively manage performance, stay compliant, and follow best practices. Our secret to helping you improve quality and achieve your organizational goals? Real-time data.
Using SHP enables you to analyze performance without having to wait for CMS to release your scores. With access to the largest database of national and state benchmarks in the industry, you can see how your organization measures up against top performing hospices, while quickly identifying trouble spots and gaining deeper insights on how to improve quality measures, case manager performance, and caregiver satisfaction.
Predictive analytics that support earlier, more proactive care
SHP's AI-powered predictive capabilities continuously analyze patient data to identify patterns in visit frequency and patient status that aren't always visible in day-to-day care delivery. By surfacing these patterns early, your team can anticipate changes in patient condition, adjust care plans proactively, and focus resources on the patients who need closer attention before a crisis develops.
Monitor trends and track performance for any date range, at any time

Patient demographic and quality
Symptom control
Potentially avoidable event (PAE) reporting
Hospice Visits in the Last Days of Life (HVLDL)

Compare with national and state benchmarks
Key performance indicators
HQRP Suite
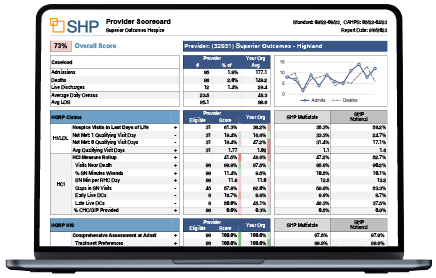
Hospice Scorecard Suite
SHP reports provide comprehensive and interactive insights to help your organization automate time-consuming tasks, prepare for public reporting and proactively monitor quality measures. Intuitive color-coding allows you to easily compare and review performance against national or state benchmarks.