PDGM Turns Two
The Medicare PDGM Prospective Payment System for Home Health recognized its second birthday on January 1st of this year. With two years of real-time data, I was interested in comparing the PDGM components and other key indicators to see how the second year compared to the first using the SHP National Database and the CMS CY 2022 Final Rule datasets. CMS also updated the Case-Mix Weights (CMWs) for each of the 432 Home Health Resource Groups (HHRGs) based on their analysis of CY 2020 claims (run as of July 12th, 2021). They used a four-step regression model that applied CY 2019 costs per visit (minutes) and non-routine supplies from claims to determine average resource use and the corresponding CMWs.
PDGM Clinical Groups as a percent of 30-day periods of care
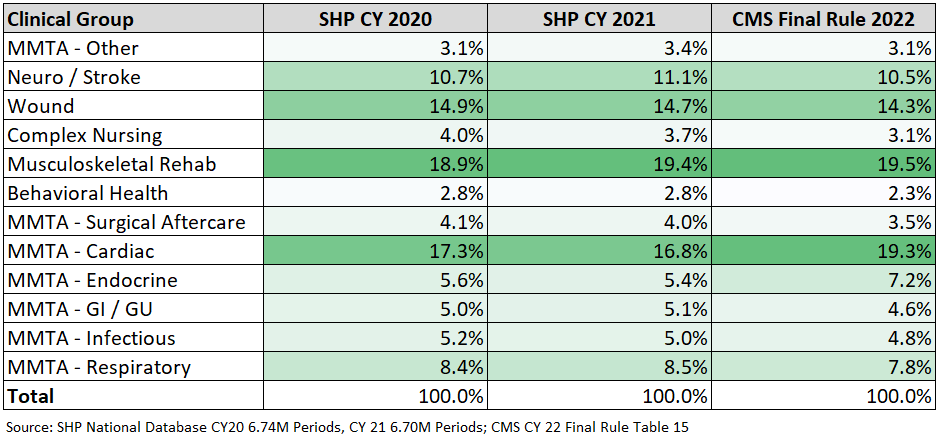
Across two years of 30-day Periods at SHP, we did not observe any significant change in the distribution by clinical group, although there are some slight differences when comparing the CMS data to the SHP CY 2020 data, the base year of their analysis.
The bigger PDGM differences are based on the changes to the Functional Impairment levels. The functional impairment level of “High” increased over three percentage points across the two years, and is much higher than the original model CMS designed for PDGM at 31.5%. In the Final Rule, CMS is applying their updated regression model to recalibrate functional impairment so that roughly a third of the 30-day periods within each clinical group would be assigned a level of low, medium or high.
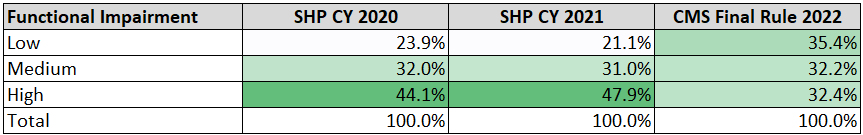
They accomplished this by reducing the points generated from the Bathing, Ambulation and Grooming OASIS scores at the Start of Care (SOC). For instance, if a patient was scored at admission on M1860 Ambulation/Locomotion as a “3 – Able to walk only with the supervision or assistance of another person at all times”, the points were reduced by almost half, from 11 to 6. Even though the point thresholds for each clinical group were also reduced across the board, CMS is projecting a more even distribution based on their regression analysis for CY 2022.
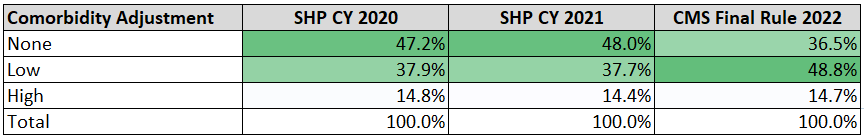
In the final rule, CMS has updated the number of secondary diagnosis subgroups applicable to the low comorbidity adjustment from 13 to 20. While the high comorbidity adjustments period percentages stayed flat across the two years, it is much higher than the original CMS PDGM modeling of 8.1%. Based on the additional subgroups, the percent of “Low” adjustments will increase by over ten percentage points to 48.8% compared to the results from SHP in the first two years. Although the number of sub-group interactions increased significantly from 31 to 87, the 14.7% of “High” comorbidity adjustments looks consistent with the last two years based on SHP data.
I was also curious to see what was happening with LUPA rates and visits. Based on the 30-day period claims received from our customers as of January 3rd, 2022, the LUPA rates stayed reasonably level across the two years, 9.1% in CY 2020 and 8.9% in CY 2021. Non-LUPA visits per 30-day period have decreased about 5 percent across the two years, averaging 9.21 visits in CY 2020 to 8.79 visits in CY 2021.
As I noted in last summer’s blog, CMWs are changing across all 432 HHRGs. The CMS final rule reflected subtle changes in CMW compared to the proposed rule, where the weights for 213 HHRGs are decreasing and the weights for 219 HHRGs are increasing compared to the prior year’s values. Although the numbers are similar, when the volume of 30-day periods is applied to the analysis one can observe the expected net change in overall agency CMWs. Comparing 30-day period SHP claims billed in CY 2021 reveals an expected overall CMW decrease of 3.1% in CY 2022 based on the same HHRG distribution. As I noted last summer, in order to make the overall Medicare payments budget neutral, CMS did finalize a 3.96% increase in the base rate.
As you begin to report home health agency key performance indicators on PDGM data this month, don’t be surprised if you find that your CMWs are lower. The proportion of high functional impairment periods will also be lower along with a higher percentage of low comorbidity adjustment periods. It is mostly a function of the final rule recalibrations, something CMS plans to implement every year. As we start the third year under PDGM, I wish everyone a productive and safe year. Happy Birthday PDGM!
Reach out to us below to see how our home health web-based data analytics and benchmarking solution can give your organization the power to effectively manage performance, stay compliant, and follow best practices.