SHP Releases Two New Home Health Star Rating Reports
With the addition of Star Ratings to Home Health Compare this year, agencies now have an indicator of overall clinical quality. However, with two-thirds of agencies being rated between 2-1/2 and 3-1/2 stars, now is the time for tools to help you differentiate your agency and identify every opportunity for improving your star ratings before they get posted by CMS. To help you achieve this goal, SHP has added two new reports to our Clinical Performance Suite.
 Click to Enlarge
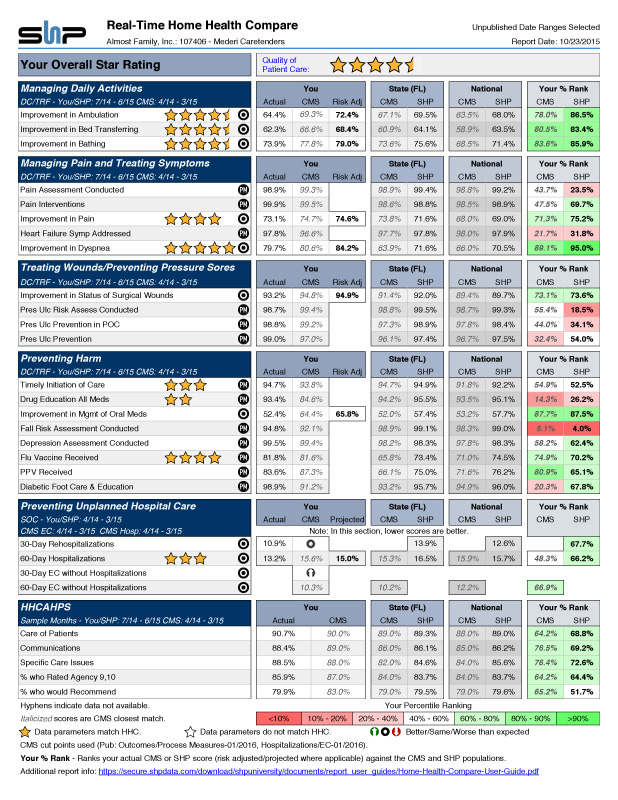
Home Health Compare Report with Real-Time Star Ratings
The new version of our popular Real-Time Home Health Compare report provides a real-time preview of what will be published on the CMS Home Health Compare website. We have evolved this report as the publicly reported data has grown in complexity.
With the inclusion of Process Measures, HHCAHPS, 30 and 60-Day Hospitalization and Star Ratings, there is now an array of metrics published by CMS that are reported based on slightly different time points and criteria. SHP preconfigured all the numerous reporting parameters in way that provides the most accurate prediction of your HHC scores in the next CMS publication cycle. While this new version of the Home Health Compare report includes the overall Star Rating value, it also has the unique ability to show the ranking for each individual measure that contributed to the overall score.
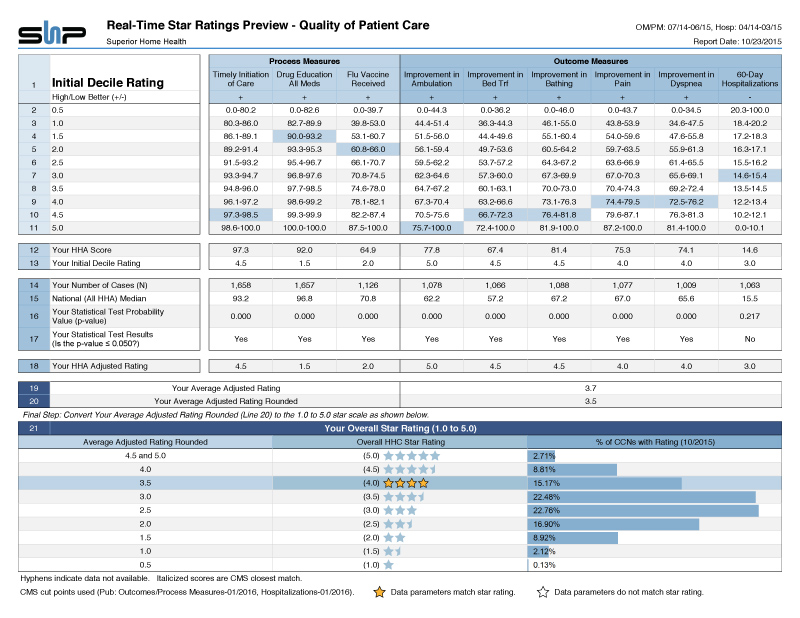
Real-Time Star Rating Preview Report
 Click to Enlarge
Want to take a deeper dive into your Star Ratings? This new report gives you a real-time preview of what will be published in the CMS Casper Star Ratings Preview - Quality of Patient Care reports months before you receive your preview reports from CMS. In addition to the default report parameters, SHP’s report groups and organizes the measures to match the formatting used by CMS.
We significantly improved the CMS format by including visual indicators highlighting which decile group your scores falls in for each measure. You will also see a histogram that shows the distribution of Star Ratings across the entire SHP benchmark.
Report User Guides
(login required)