Now that CY 2023 is closed and we await the CMS CY 2025 proposed rule for home health, it is an opportune time to revisit the data trends in the Patient Driven Groupings Model (PDGM) by leveraging SHP national benchmarks. Delving into these insights, one can discern intriguing patterns that have emerged over the years. To no one’s surprise, Home Health Agency (HHA) Medicare visits per 30-day period have continued to decrease over the first four years of PDGM.
As this chart depicts, total visits have declined 9.2% since the inception of PDGM and across each discipline with one exception, physical therapy (PT). PT visits per period have been stable over the last 4 years, perhaps a statement of the importance HHAs have placed on improving functional status for their patients. This stability underscores the industry's commitment to enhancing functional status, possibly fueled by CMS HHVBP measures like the Total Normalized Composites for Mobility and Self-care.

The impact of CMS' behavioral adjustments on payments has spurred HHAs to innovate, focusing on quality enhancement and identifying efficiencies in care delivery. Equipped with data-science-backed tools, agencies now possess better predictive capabilities to tailor care to individual patient needs, thus optimizing outcomes.
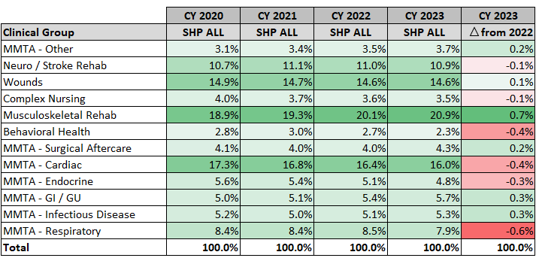
Reviewing 30-day period breakouts by Clinical Group, we see that they have remained largely unchanged in the first four years of PDGM. Contrary to CMS' initial concerns regarding agencies exploiting clinical groups for higher reimbursements, no significant shifts have occurred. In fact, clinical groups with the highest payment rates, such as Wounds, have seen a decrease, while others, like MS Rehab, have experienced an uptick, more likely due to rising elective surgeries post-COVID.

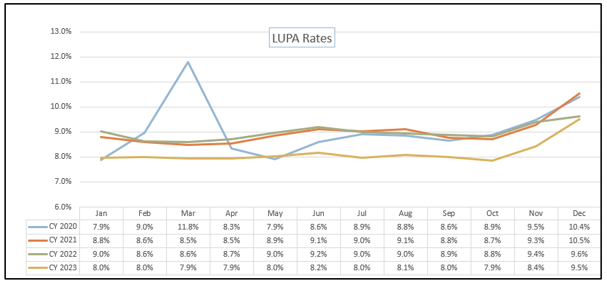
A particularly intriguing trend lies in the Low Utilization Payment Adjustments (LUPA) rates. As you may recall, CMS had predicted HHAs would lower their LUPA rates by increasing visits to just at or one visit over the LUPA thresholds to receive full payment. LUPA rates never dropped anywhere near the levels CMS had predicated based on their original assumptions (~6.0%).
For the first time since PDGM began, CMS re-adjusted the LUPA thresholds in CY 2023 by identifying the higher of the 10th percentile of visits or two visits (whichever is higher) for each Home Health Resource Group (HHRG) using claims data from CY 2021. As outlined in the CY 2023 Final Rule, LUPA thresholds decreased in 134 HHRGs and only increased in 16 HHRGs. In CY 2023, there were no longer any 6 visit thresholds, just 2 – 5 visits thresholds.

Notice in this chart that, other than the first six months of CY 2020, LUPA rates for the first three years have been very consistent. In CY 2023, there is just under a 1% percentage point decline in rates across each month in that year. This is likely the result of the declining visits observed in the first couple of years of PDGM, compared to pre-PDGM, that reduced the LUPA thresholds.
There have been other interesting trends when it comes to PDGM components such as Functional Impairment and Comorbidity Adjustment coding as CMS began recalibrating PDGM Case-Mix Weights (CMW) beginning in CY 2022. CMS is looking to bring the percent of periods for functional impairment (low, medium and high) to about 33.3% in each, as well as achieving budget neutrality in the national payment rates.
To delve deeper into these insights and gain additional perspectives on PDGM trends observed during its fourth year, I invite you to join me and Zeb Clayton, VP of Client Services, in a webinar on Wednesday, April 17th. Together, we'll explore further PDGM trending nuances using data from the SHP national database. Click the link below to register and participate in the discussion. Let's navigate the evolving landscape of PDGM together, armed with insights and foresight.


