PDGM Insights are in the Period Details
The home health industry is six months away from the start of a new reimbursement methodology that eliminates therapy visits as a case-mix adjuster and establishes new 30-day periods of payment. The Center of Medicare and Medicaid Services (CMS) used industry claims data and regression analyses to develop the case weights for 432 new Patient-Driven Grouping Model (PDGM) payments defined by components of period timing, admission source, clinical categories, functional impairments and comorbidities.
The National Association of Home and Hospice Care (NAHC) recently presented a national summit on PDGM and most recently, monthly webinars for greater insights to these components within PDGM. To help educate the audiences, many of these presentations have reported on PDGM metrics and payments using average values.
For instance, and good news for the industry, according to CMS the average Low Utilization Payment Adjustment (LUPA) rate under PDGM will be close to the current PPS national rate of approximately eight percent. In looking at data from our SHP National base, we see something similar with the CY 2017/2018 national LUPA rate at 9.7% and under PDGM a comparative rate of 8.9%. But like any average, the devil is in the details. Breaking out LUPA rates based on the sequence of PDGM 30-day periods revealed the following:

Period 2 had the highest LUPA rate compared to the other periods. In fact when you add clinical category you can see some additional insights. Complex Nursing has the highest LUPA rate for all periods in a sequence other than Period 2 (see chart).
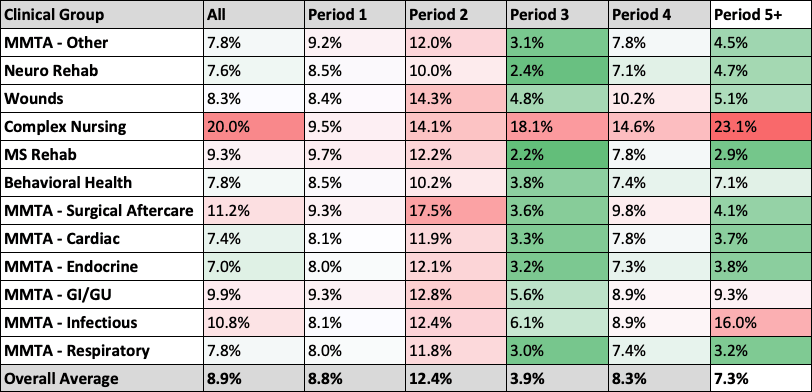
It is helpful to see how low the LUPA rates are in Period 3 when patients are recertified for a second 60-day clinical episode. It begins to suggest where agencies might want to focus to prevent avoidable LUPA adjustments in the future.
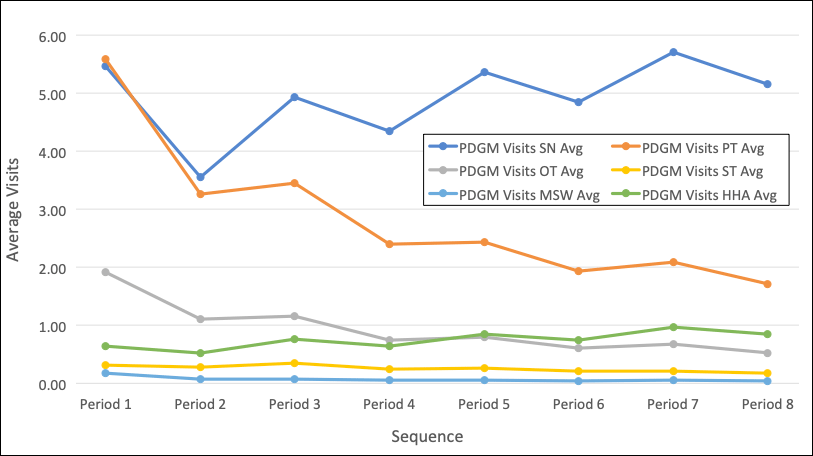
Another distinction can be observed with visit utilization when broken out by period. As expected, visits in the first 30 days is higher than the second period.

Looking at later periods shows that the visits fluctuate based on the first/second period sequencing of the 60-day clinical episodes. Breaking that out further by discipline, the data begins to show where agency visits (and costs) may or may not match up to the “late” period revenue.
Comparing 30-day periods as an overall average can be misleading. It is more meaningful to break out this data into the sequence of periods across groupings like clinical category. In this way one can analyze the impacts of periods to help define the clinical and operational improvements necessary to manage your agencies under PDGM.
Please join me and Sue Payne, VP and Chief Clinical Officer from Corridor, on June 26th for our webinar on “Managing Utilization under PDGM with Star Ratings in Mind” as we share some additional insights in preparing for PDGM.
Tags