The national expansion of the Home Health Value-Based Purchasing Program (HHVBP) first Performance Year (PY) began January 1st, 2023. Home health agency quality episodes reported in CY 2023 across twelve separate measures will be compared to a national peer group based on size to determine whether you will be eligible for positive or negative payment adjustments. Payment adjustments from the PY 2023 will take effect for all Medicare FFS payments in CY 2025.
In my blog this fall, I was lamenting that agencies would not know how they were performing until the first Interim Payment Report (IPR) is posted in July 2023. This is in part due to the changing of the HHVBP model and agency baseline years from CY 2019 to CY 2022. Since there are inherent delays in public reporting of quality scores, it would necessitate delaying when complete CY 2022 data could be shared.
The good news is CMS is now providing a Pre-Implementation Performance Report (PIPR) to compare agency scores with slightly older time periods. These reports will compare how agencies are performing against their peers by showing percentile ranking scores for the larger and smaller-volume cohorts (25th, 50th, 75th and mean of the 90th). Since the CY 2022 baseline data is not finalized, CMS is providing scores for the 12 months of rolling quarters based on the following schedule:

The July 2023 Interim Payment Report (IPR) will reflect the finalized 2022 baseline data that will be used in the HHVBP Total Performance Score (TPS).
On January 26th, CMS provided the second of three reports. In a November webinar, CMS shared the details of the PIPR report and how to interpret the data. A couple of highlights:
- Responds to requests of CMS to provide agencies with data prior to the start of the first performance year
- Helps you to become familiar with subsequent reports, like IPRs and APRs, that will be released later in the Model
- Allows you to see how you’re doing compared to peers nationally at this point in time
What it isn’t showing is the measure weighting that emphasizes the claims-based measures with proportionately more points (35% across two measures), nor does it show a TPS score. The HHVBP program uses the TPS and a linear exchange function to determine your final payment adjustment.
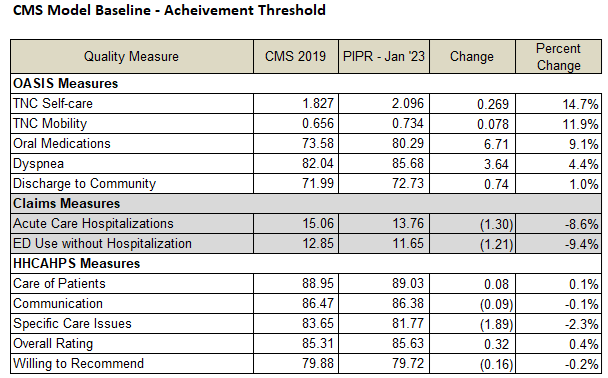
However, the 50th percentile and the mean of the top decile does provide some insight since it approximates the “Achievement Threshold” and the “Benchmark” used in the HHVBP model. Although not complete for CY 2022, the January report released last month is much closer to the values we may see in the July IPR than the CY 2019 scores shared last June. Comparing the January 2023 PIPR scores to the CMS 2019 baseline scores does point out something we observed under the HHVBP CMMI demonstration – OASIS scores have continued to improve. I compared the larger-volume cohort Achievement Thresholds between these two periods in the chart below:

OASIS-based measures increased between to the two time points, with the TNC scores improving the most. Claims-based outcomes also improved very well (lower is better). It is only the HHCHAPS measures that have changed very little, and in some cases, have declined. Specific Care Issues show the greatest change, down 1.89 points or a percent change of -2.3%.
One thing to note about your TPS scores in comparing the CMS 2019 baselines to the latest PIPR reports. With the increases in the achievement thresholds (or mean scores), your CY 2023 HHVBP measure outcomes will earn fewer achievement points since “the bar was raised”. Agencies need to be above the mean score to earn achievement points. Improvement points are earned by comparing agency CY 2023 scores to your agency CY 2022 baseline scores. It makes sense that agencies will show less improvement when compared to the CY 2022 agency baselines instead of the CY 2019 agency baselines.
Since raising the bar affects all agencies, your relative position will likely not change, but don’t be surprised by the significant decrease if you have been tracking TPS scores. This is a similar effect that agencies experienced during the 4th year of the CMMI demonstration when CMS introduced the new HHVBP measure weightings and added new TNC scores that used a more current baseline year.
In one example, I looked at an agency that had a TPS score of 47.63 in CY 2022 using the CY 2019 model and agency baselines, that decreased to a of TPS score of 29.61 using the same CY 2022 scores along with the updated model and agency baselines. To help our clients to track these changes, the SHP VBP National Preview report will be updated using the January PIPR achievement thresholds and benchmarks as proxies to the CY 2022 model baselines.
This will be available in the coming weeks. Using these reports will give you a head start on how your agency is performing using your real-time TPS scores. Join Zeb Clayton and I as we present HHVBP updates during a webinar in March. Watch for the upcoming invitation!

